6.4实验结论
本文所讨论的基于遗传算法的图像分割算法,采用标准遗传算法作为计算流程,但对其中的选择算子进行了改变,用高级选择函数select代替了传统的单一选择算子,使得在每次选择运算后所得的父辈更为健壮,更好的保持了第一代父辈的表现型,使得分割更加精确。通过设计变异概率,使得每次迭代遗传运算后,子代的表现型略有改变,从而更以获得最优的表现型(即最优阈值),减少了迭代寻优次数,降低了程序运行时间。同时考虑到过多迭代不利于降低程序运行时间,以及在寻优过程中的最佳值收敛问题,指定迭代次数为50次时即跳出整个程序,通过反编码求得最优阈值,并通过变量调用,直接应用于下面的分割程序,达到了整个算法的自动完成。
相对于灰度直方图双峰法,本方法对图像的先验信息要求不高,不需要像灰度直方图法那样,先通过获得图像的灰度直方图取得分割阈值后再对图像处理,整个程序的自动化程度高,且对于那些灰度直方图不呈双峰分布的图像,本算法程序一样可以处理,这就扩大了本算法程序的灵活性,从而更具有实际意义。而且,由于灰度直方图双峰法的阈值是通过人眼观察获得,其误差必然大于机器迭代运算所取得的最优阈值,而普通的阈值分割法,如ostu法,虽然实现了阈值的自动选择,但其运算时间与本算法相比偏长,实时性差于本算法。因此,在图像分割算法中,基于遗传算法的图像分割算法更优于其它传统的图像分割算法。
通过上述讨论,以及两种方法的处理结果图片的对比,基于遗传算法的最大类间方差法分割后图像与直方图双峰法分割后的图像像比,效果更明显,且无须事先测量图像的灰度直方图,更加灵活,更加精确。wWw.11665.cOM
其相关试验结论列于下表:
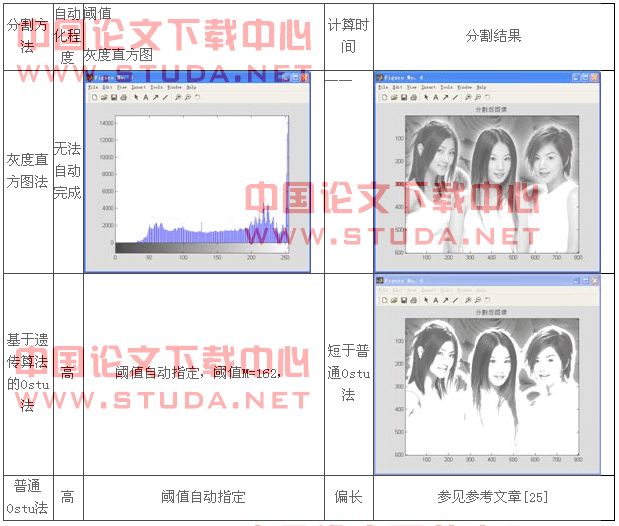
基于遗传算法的图象分割实验结论总表:
分割方法
自动化程度
阈值
灰度直方图
计算时间
分割结果
灰度直方图法
无法自动完成
――
基于遗传算法的ostu法
高
阈值自动指定,阈值m=162,
短于普通ostu法
普通ostu法
高
阈值自动指定
偏长
参见参考文章[25]
参 考 文 献
[1]张兆礼,赵春晖,梅晓丹.现代图像处理技术及mathab实现.北京:人民邮电出版社,2001.1
[2]陈传波,金先级.数字图像处理[m].北京:机械工业出版社,2004.
[3]夏德深,傅德胜等.现代图象处理技术与应用[m].南京:东南大学出版社,1997.
[4]章毓晋.图象工程(上册)图象处理和分析.北京:清华大学出版社,1999.
[5]王小平,曹立明.遗传算法理论、应用与软件实现.西安:西安交大出版社,2002.
[6]徐立中,数字图像的智能信息处理。北京:国防工业出版社,2001
[7]王耀南,李树涛,毛建旭,计算机图像处理与识别技术,北京:高等教育出版社,2001
[8]雷英杰,张善文,李绪武,周创明.matlab遗传算法工具箱及应用,西安:西安电子科技大学出版社
[9]何新贵.模糊知识处理的理论与计算,国防工业出版社,1999
[10]徐建华.图像处理与分析,北京:科学出版,1992.
[11]阮秋琦.数字图象处理学,电子工业出版社,2001
[12]王博等.图像平滑与边缘检测的模糊向量描述,小型微型计算机统,vol. 20(3), 1999
[13]吴谨,李娟,刘成云,基于最大熵的灰度阈值选取方法,武汉科技大学学报(自然科学版),vol. 27, no. 1, mar, 2004
[14]李鉴庆,左坤隆,图像阈值选取的一种快速算法.计算机与现代化,2001年第6期
[15]魏宝刚,鲁东明,潘云鹤等.多颜色空间上的互式图像分割[j].计算机学报,2001, 24 (7):770-775
[16]杜亚勤,基于模糊集的图像边缘检测技术研究:[硕士学位论文].西安:西安工业学院,2004年4月
[17]王保平,基于模糊技术的图像处理方法研究[博士学位论文],西安:西安电子科技大学,2004, 9
[18]杜亚娟,潘泉,周德龙等,图像多级灰度非线性模糊增强算法研究,数据采集与处vo1.14 no.2
[19]russ j c, the image processing handbook. new york:crc press,1994
[20]l a zadeh.fuzzy sets[j].information and contro1,1965, (8):338-353
[21]lotfi a.zadeh,a fuzzy-set-theoretic interpretation of linguistic hedges, journal of cybernetic, 1972, 64(2):4-34
[22]s. k. pal, r. a. king. image enhancement using fuzzy sets. electron. let t.,1980 16 (9):376-378.
[23]s. k. pai, r. :a. king, on edge detection of r-ray images using fuzzy sets. ieee trans.patt. anal and machineintell.1983,pami-5 (1):69-77.
[24]otsu n. a threshold selection method from gray level histograms. ieee trans on syst man cybernet, 1979, smc-9:62-66
附 录 附录 一
灰度直方图双峰法分割源代码
clear, close all
b=imread('2.jpg'); %读入原始jpg格式图像
figure(1);
imshow(b),title('原始jpg格式图像');
i1=rgb2gray(b); %将原图像转化为灰度图象
figure(2);
imshow(i1),title('灰度格式图像');
[i1,map1]=gray2ind(i1,255); %将灰度图像转化为索引图像
figure(3), imhist(i1) %画出灰度直方图,以判断域值
i1=double(i1); %将unit8数组转化为double型数组
z=i1 %将double型数组i1转存到z中
[m, n]=size(z);
for i=1:m
for j=1:n
if z(i,j)>240 %灰度值大于域值时是白色
z(i,j)=256;
end
end
end
figure(4) %画出分割后目标图像
image(z),title('分割后图像');colormap(map1);
图像i图像格式转化及灰度直方图双峰法分割源代码
clear, close all
b=imread('she.jpg'); %读入原始jpg格式图像she
figure(1);
imshow(b),title('原始jpg格式图像');
i1=rgb2gray(b); %将原图像转化为灰度图象
figure(2);
imshow(i1),title('灰度格式图像');
[i1,map1]=gray2ind(i1,255); %将灰度图像转化为索引图像
figure(3), imhist(i1) %画出灰度直方图,以判断域值
i1=double(i1); %将unit8数组转化为double型数组
z=i1 %将double型数组i1转存到z中
[m, n]=size(z);
for i=1:m
for j=1:n
if z(i,j)>240 %灰度值大于域值时是白色
z(i,j)=256;
end
end
end
figure(4) %画出分割后目标图像
image(z),title('分割后图像');colormap(map1);
图像ii图像格式转化及灰度直方图双峰法分割源代码
clear, close all
b=imread('she.jpg'); %读入原始jpg格式图像月亮
figure(1);
imshow(b),title('原始jpg格式图像');
i1=rgb2gray(b); %将原图像转化为灰度图象
figure(2);
imshow(i1),title('灰度格式图像');
[i1,map1]=gray2ind(i1,255); %将灰度图像转化为索引图像
figure(3), imhist(i1) %画出灰度直方图,以判断域值
i1=double(i1); %将unit8数组转化为double型数组
z=i1 %将double型数组i1转存到z中
[m, n]=size(z);
for i=1:m
for j=1:n
if z(i,j)>240 %灰度值大于域值时是白色
z(i,j)=256;
end
end
end
figure(4) %画出分割后目标图像
image(z),title('分割后图像');colormap(map1);
附录 二
crtbp 函数源代码:(由谢菲尔德大学andrew chipperfield编写)
% crtbp.m - create an initial population%
% this function creates a binary population of given size and structure.
%
% syntax: [chrom lind basev] = crtbp(nind, lind, base)
%
% input parameters:
%
% nind - either a scalar containing the number of individuals
% in the new population or a row vector of length two
% containing the number of individuals and their length.
%
% lind - a scalar containing the length of the individual
% chromosomes.
%
% base - a scalar containing the base of the chromosome
% elements or a row vector containing the base(s)
% of the loci of the chromosomes.
%
% output parameter
s:
%
% chrom - a matrix containing the random valued chromosomes
% row wise.
%
% lind - a scalar containing the length of the chromosome.
%
% basev - a row vector containing the base of the
% chromosome loci.
% author: andrew chipperfield
% date: 19-jan-94
function [chrom, lind, basev] = crtbp(nind, lind, base)
nargs = nargin ;
% check parameter consistency
if nargs >= 1, [mn, nn] = size(nind) ; end
if nargs >= 2, [ml, nl] = size(lind) ; end
if nargs == 3, [mb, nb] = size(base) ; end
if nn == 2
if (nargs == 1)
lind = nind(2) ; nind = nind(1) ; basev = crtbase(lind) ;
elseif (nargs == 2 & nl == 1)
basev = crtbase(nind(2),lind) ; lind = nind(2) ; nind = nind(1) ;
elseif (nargs == 2 & nl > 1)
if lind ~= length(lind), error('lind and base disagree'); end
basev = lind ; lind = nind(2) ; nind = nind(1) ;
end
elseif nn == 1
if nargs == 2
if nl == 1, basev = crtbase(lind) ;
else, basev = lind ; lind = nl ; end
elseif nargs == 3
if nb == 1, basev = crtbase(lind,base) ;
elseif nb ~= lind, error('lind and base disagree') ;
else basev = base ; end
end
else
error('input parameters inconsistent') ;
end
% create a structure of random chromosomes in row wise order, dimensions
% nind by lind. the base of each chromosomes loci is given by the value
% of the corresponding element of the row vector base.
chrom = floor(rand(nind,lind).*basev(ones(nind,1),:)) ;
% end of file
附录 三
bs2rv函数源代码: (由谢菲尔德大学andrew chipperfield编写)
% bs2rv.m - binary string to real vector
%
% this function decodes binary chromosomes into vectors of reals. the
% chromosomes are seen as the concatenation of binary strings of given
% length, and decoded into real numbers in a specified interval using
% either standard binary or gray decoding.
%
% syntax: phen = bs2rv(chrom,fieldd)
%
% input parameters:
%
% chrom - matrix containing the chromosomes of the current
% population. each line corresponds to one
% individual's concatenated binary string
% representation. leftmost bits are msb and
% rightmost are lsb.
%
% fieldd - matrix describing the length and how to decode
% each substring in the chromosome. it has the
% following structure:
%
% [len; (num)
% lb; (num)
% ub; (num)
% code; (0=binary | 1=gray)
% scale; (0=arithmetic | 1=logarithmic)
% lbin; (0=excluded | 1=included)
% ubin]; (0=excluded | 1=included)
%
% where
% len - row vector containing the length of
% each substring in chrom. sum(len)
% should equal the individual length.
% lb,
% ub - lower and upper bounds for each
% variable.
% code - binary row vector indicating how each
% substring is to be decoded.
% scale - binary row vector indicating where to
% use arithmetic and/or logarithmic
% scaling.
% lbin,
% ubin - binary row vectors indicating whether
% or not to include each bound in the
% representation range
%
% output parameter:
%
% phen - real matrix containing the population phenotypes.
%
% author: carlos fonseca, updated: andrew chipperfield
% date: 08/06/93, date: 26-jan-94
function phen = bs2rv(chrom,fieldd)
% identify the population size (nind)
% and the chromosome length (lind)
[nind,lind] = size(chrom);
% identify the number of decision variables (nvar)
[seven,nvar] = size(fieldd);
if seven ~= 7
error('fieldd must have 7 rows.');
end
% get substring properties
len = fieldd(1,:);
lb = fieldd(2,:);
ub = fieldd(3,:);
code = ~(~fieldd(4,:));
scale = ~(~fieldd(5,:));
lin = ~(~fieldd(6,:));
uin = ~(~fieldd(7,:));
% check substring properties for consistency
if sum(len) ~= lind,
error('data in fieldd must agree with chromosome length');
end
if ~all(lb(scale).*ub(scale)>0)
error('log-scaled variables must not include 0 in their range');
end
% decode chromosomes
phen = zeros(nind,nvar);
lf = cumsum(len);
li = cumsum([1 len]);
prec = .5 .^ len;
logsgn = sign(lb
(scale));
lb(scale) = log( abs(lb(scale)) );
ub(scale) = log( abs(ub(scale)) );
delta = ub - lb;
prec = .5 .^ len;
num = (~lin) .* prec;
den = (lin + uin - 1) .* prec;
for i = 1:nvar,
idx = li(i):lf(i);
if code(i) % gray decoding
chrom(:,idx)=rem(cumsum(chrom(:,idx)')',2);
end
phen(:,i) = chrom(:,idx) * [ (.5).^(1:len(i))' ];
phen(:,i) = lb(i) + delta(i) * (phen(:,i) + num(i)) ./ (1 - den(i));
end
expand = ones(nind,1);
if any(scale)
phen(:,scale) = logsgn(expand,:) .* exp(phen(:,scale));
end
附录 四
适应度函数target源代码:
function f=target(t,m) %适应度函数,t为待处理图像,m为域值序列
[u, v]=size(t);
w=, , length(m);
f=zeros(w,1);
for k=1:w
i=0;s1=0;j=0;s2=0; %统计目标图像和背景图像的像素数及像素之和
for i=1:u
for j=1:v
if t(i,j)<=m(k)
s1=s1+t(i,j);i=i+1;
end
if t(i,j)>m(k)
s2=s2+t(i,j);j=j+1;
end
end
end
if i==0, p1=0; else p1=s1/i; end
if j==0, p2=0; else p2=s2/j; end
f(k)=i*j*(p1-p2)*(p1-p2)/(256*256);
end
附录 五
选择函数select源代码:(由谢菲尔德大学hartmut pohlheim编写)
% select.m (universal selection)
%
% this function performs universal selection. the function handles
% multiple populations and calls the low level selection function
% for the actual selection process.
%
% syntax: selch = select(sel_f, chrom, fitnv, ggap, subpop)
%
% input parameters:
% sel_f - name of the selection function
% chrom - matrix containing the individuals (parents) of the current
% population. each row corresponds to one individual.
% fitnv - column vector containing the fitness values of the
% individuals in the population.
% ggap - (optional) rate of individuals to be selected
% if omitted 1.0 is assumed
% subpop - (optional) number of subpopulations
% if omitted 1 subpopulation is assumed
%
% output parameters:
% selch - matrix containing the selected individuals.
% author: hartmut pohlheim
% history: 10.03.94 file created
function selch = select(sel_f, chrom, fitnv, ggap, subpop);
% check parameter consistency
if nargin < 3, error('not enough input parameter'); end
% identify the population size (nind)
[nindch,nvar] = size(chrom);
[nindf,varf] = size(fitnv);
if nindch ~= nindf, error('chrom and fitnv disagree'); end
if varf ~= 1, error('fitnv must be a column vector'); end
if nargin < 5, subpop = 1; end
if nargin > 4,
if isempty(subpop), subpop = 1;
elseif isnan(subpop), subpop = 1;
elseif length(subpop) ~= 1, error('subpop must be a scalar'); end
end
if (nindch/subpop) ~= fix(nindch/subpop), error('chrom and subpop disagree'); end
nind = nindch/subpop; % compute number of individuals per subpopulation
if nargin < 4, ggap = 1; end
if nargin > 3,
if isempty(ggap), ggap = 1;
elseif isnan(ggap), ggap = 1;
elseif length(ggap) ~= 1, error('ggap must be a scalar');
elseif (ggap < 0), error('ggap must be a scalar bigger than 0'); end
end
% compute number of new individuals (to select)
nsel=max(floor(nind*ggap+.5),2);
% select individuals from population
selch = [];
for irun = 1:subpop,
fitnvsub = fitnv((irun-1)*nind+1:irun*nind);
chrix=feval(sel_f, fitnvsub, nsel)+(irun-1)*nind;
selch=[selch; chrom(chrix,:)];
end
% end of function
附录 六
交叉函数recombin的源代码:(由谢菲尔德大学hartmut pohlheim编写)
% recombin.m (recombination high-level function)
%
% this function performs recombination between pairs of individuals
% and returns the new individuals after mating. the function handles
% multiple populations and calls the low-level recombination function
% for the actual recombination process.
%
% syntax: newchrom = recombin(rec_f, oldchrom, recopt, subpop)
%
% input parameters:
% rec_f - string containing the name of the recombination or
% crossover function
% chrom - matrix containing the chromosomes of the old
% population. each line corresponds to one individual
% recopt - (optional) scalar containing the probability of
% recombination/crossover occurring between pairs
% of individuals.
% if omitted or nan, 1 is assumed
% subpop - (optional) number of subpopulations
% if omitted or nan, 1 subpopulation is assumed
%
% output parameter:
% newchrom - matrix containing the chromosomes of the population
% after recombination in the same format as oldchrom.
% author: hartmut pohlheim
% history: 18.03.94 file created
function newchrom = recombin(rec_f, chrom, recopt, subpop);
% check parameter consistency
if nargin < 2, error('not enough input parameter'); end
% identify the population size (nind)
[nind,nvar] = size(chrom);
if nargin < 4, subpop = 1; end
if nargin > 3,
if isempty(subpop), subpop = 1;
elseif isnan(subpop), subpop = 1;
elseif length(subpop) ~= 1, error('subpop must be a scalar'); end
end
if (nind/subpop) ~= fix(nind/subpop), error('chrom and subpop disagree'); end
nind = nind/subpop; % compute number of individuals per subpopulation
if nargin < 3, recopt = 0.7; end
if nargin > 2,
if isempty(recopt), recopt = 0.7;
elseif isnan(recopt), recopt = 0.7;
elseif length(recopt) ~= 1, error('recopt must be a scalar');
elseif (recopt < 0 | recopt > 1), error('recopt must be a scalar in [0, 1]'); end
end
% select individuals of one subpopulation and call low level function
newchrom = [];
for irun = 1:subpop,
chromsub = chrom((irun-1)*nind+1:irun*nind,:);
newchromsub = feval(rec_f, chromsub, recopt);
newchrom=[newchrom; newchromsub];
end
% end of function
附录 七
变异函数mut源代码 :(由谢菲尔德大学andrew chipperfield编写)
% mut.m
%
% this function takes the representation of the current population,
% mutates each element with given probability and returns the resulting
% population.
%
% syntax: newchrom = mut(oldchrom,pm,basev)
%
% input parameters:
%
% oldchrom - a matrix containing the chromosomes of the
% current population. each row corresponds to
% an individuals string representation.
%
% pm - mutation probability (scalar). default value
% of pm = 0.7/lind, where lind is the chromosome
% length is assumed if omitted.
%
% basev - optional row vector of the same length as the
% chromosome structure defining the base of the
% individual elements of the chromosome. binary
% representation is assumed if omitted.
%
% output parameter:
%
% newchrom - a matrix containing a mutated version of
% oldchrom.
%
% author: andrew chipperfield
% date: 25-jan-94
function newchrom = mut(oldchrom,pm,basev)
% get population size (nind) and chromosome length (lind)
[nind, lind] = size(oldchrom) ;
% check input parameters
if nargin < 2, pm = 0.7/lind ; end
if isnan(pm), pm = 0.7/lind; end
if (nargin < 3), basev = crtbase(lind); end
if (isnan(basev)), basev = crtbase(lind); end
if (isempty(basev)), basev = crtbase(lind); end
if (nargin == 3) & (lind ~= length(basev))
error('oldchrom and basev are incompatible'), end
% create mutation mask matrix
basem = basev(ones(nind,1),:) ;
% perform mutation on chromosome structure
newchrom = rem(oldchrom+(rand(nind,lind)<pm).*ceil(rand(nind,lind).*(basem-1)),basem);
附录 八
基于遗传算法的最大类间方差法对jpg格式图像分割的程序源代码:
clear, close all
b=imread('she.jpg'); %读入原始jpg格式图像
figure(1);
imshow(b),title('原始jpg格式图像');
i1=rgb2gray(b); %将原图像转化为灰度图象
figure(2);
imshow(i1),title('灰度格式图像');
bw1 = edge(i1,'sobel');
bw2 = edge(i1,'canny');
figure(6),imshow(bw1),title('边缘检测1'); %边缘检测
figure(5), imshow(bw2),title('边缘检测2');
[i1,map1]=gray2ind(i1,255); %将灰度图像转化为索引图像
i1=double(i1); %将unit8数组转化为double型数组
z=i1 %将double型数组i1转存到z中
figure(3) %画出未进行分割的原始图像
image(z),title('未进行分割的原始图像');colormap(map1);
nind=40; %个体
数目(number of individuals)
maxgen=50; %最大遗传代数(maximum number of generations)
preci=8; %变量的二进制位数(precision of variables)
ggap=0.9; %代沟(generation gap)
fieldd=[8;1;256;1;0;1;1]; %建立区域描述器(build field descriptor)
chrom=crtbp(nind,preci); %创建初始种群
gen=0;
phen=bs2rv(chrom,fieldd); %初始种群十进制转换
objv=target(z,phen); %计算种群适应度值
while gen<maxgen %代沟(generation gap)
fitnv=ranking(-objv); %分配适应度值(assign fitness values)
selch=select('sus',chrom,fitnv,ggap); %选择
selch=recombin('xovsp',selch,0.7); %重组
selch=mut(selch); %变异
phensel=bs2rv(selch,fieldd); %子代十进制转换
objvsel=target(z,phensel);
[chrom objv]=reins(chrom,selch,1,1,objv,objvsel); %重插入
gen=gen+1;
end
[y, i]=max(objv);
m=bs2rv(chrom(i,:),fieldd); %估计域值
[m, n]=size(z);
for i=1:m
for j=1:n
if z(i,j)>m %灰度值大于域值时是白色
z(i,j)=256;
end
end
end
figure(4) %画出分割后目标图像
image(z),title('分割后图像');colormap(map1);
target求适应度函数代码:
function f=target(t,m) %适应度函数,t为待处理图像,m为域值序列
[u, v]=size(t);
w=length(m);
f=zeros(w,1);
for k=1:w
i=0;s1=0;j=0;s2=0; %统计目标图像和背景图像的像素数及像素之和
for i=1:u
for j=1:v
if t(i,j)<=m(k)
s1=s1+t(i,j);i=i+1;
end
if t(i,j)>m(k)
s2=s2+t(i,j);j=j+1;
end
end
end
if i==0, p1=0; else p1=s1/i; end
if j==0, p2=0; else p2=s2/j; end
f(k)=i*j*(p1-p2)*(p1-p2)/(256*256);
end;